Trusted by 2,400+ enterprise teams
The intelligence layer
your business deserves.
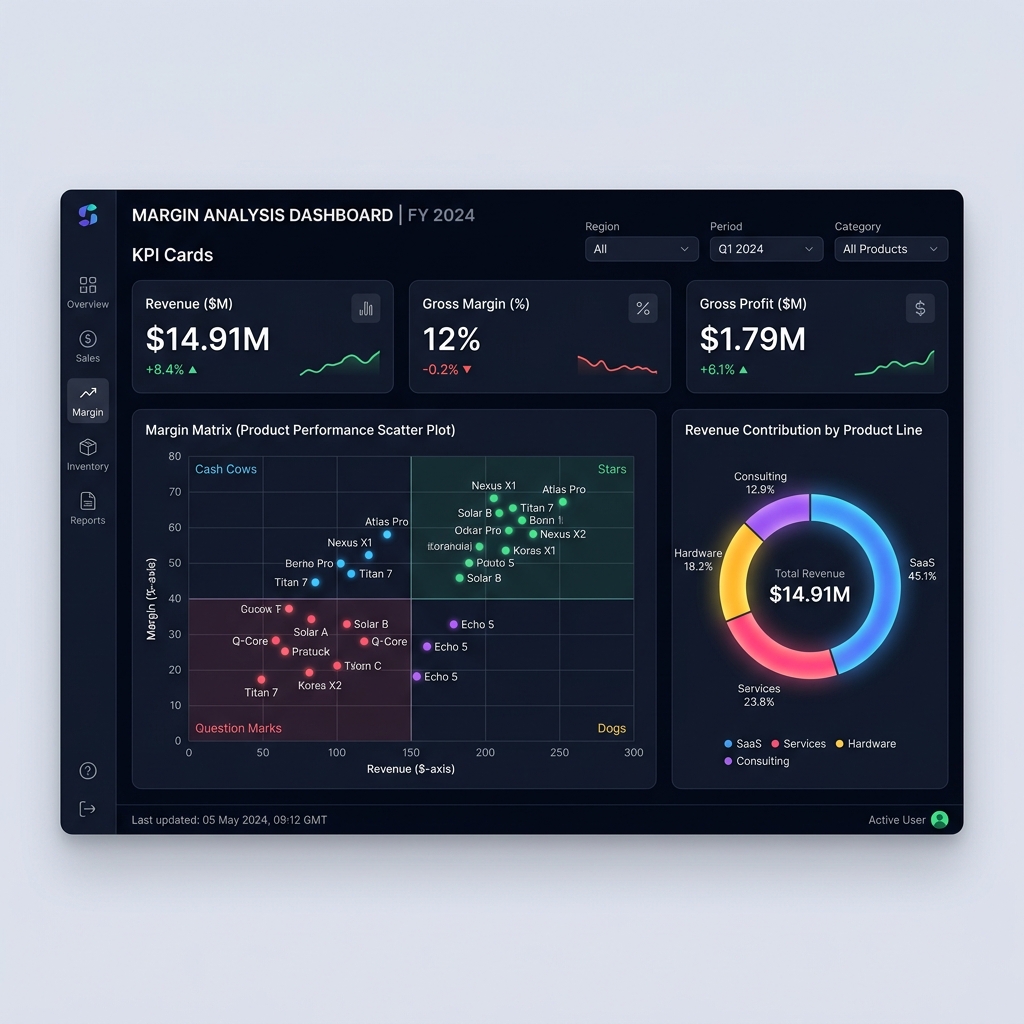
Revelaer BI unifies your data streams into real-time dashboards, margin analytics, and AI-driven forecasts — all in one platform built for scale.
Revenue+12.5%
$14.91M
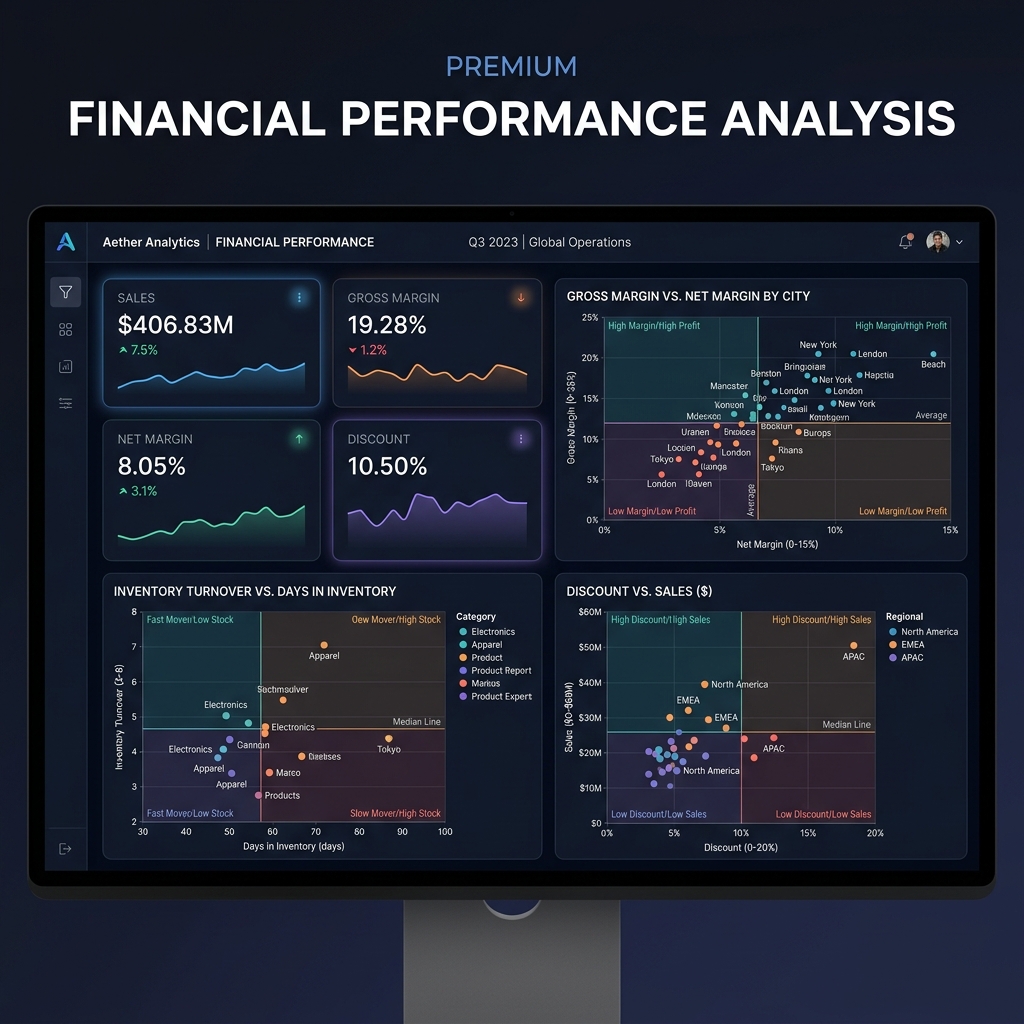
Gross Margin+3.2%
19.28%
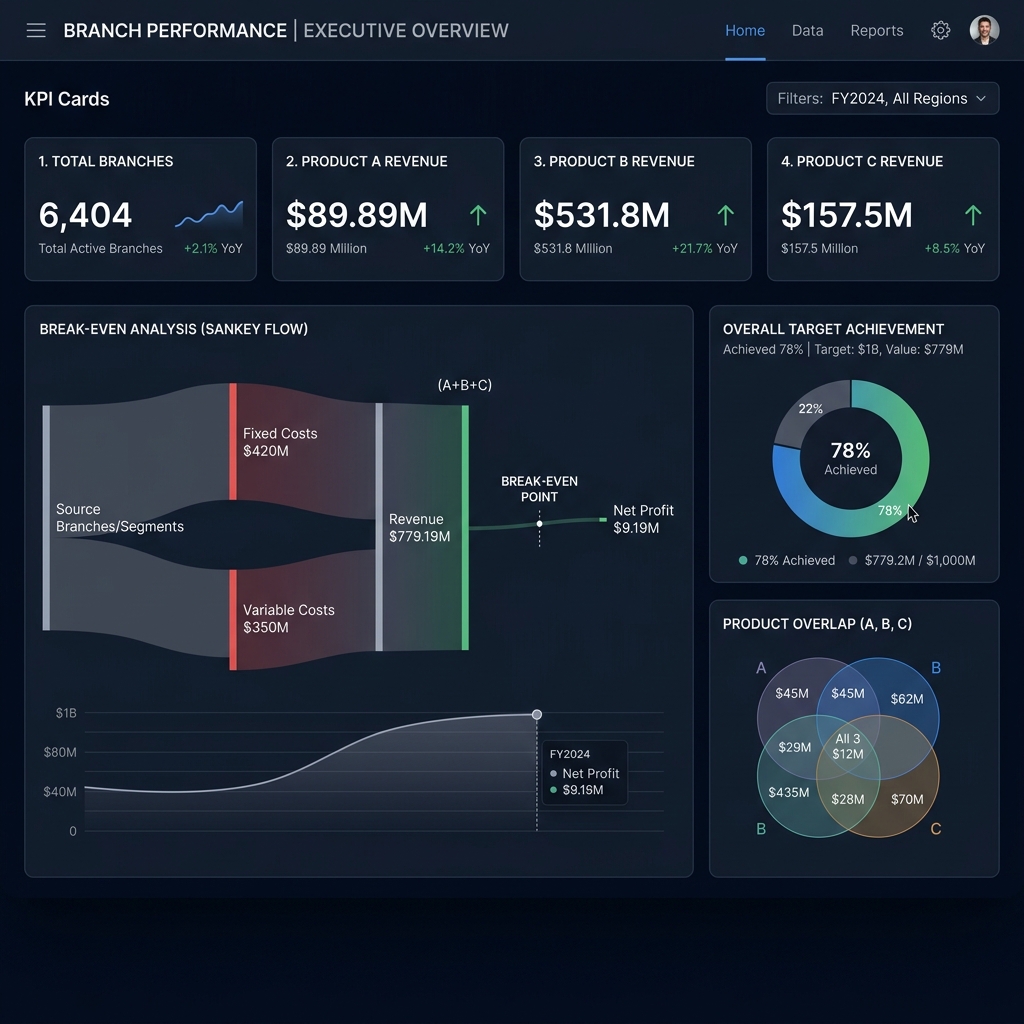
Active Branches+5.8%
6,404